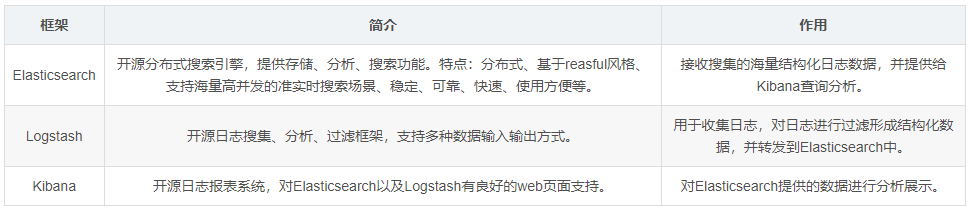
ELK是一套针对日志数据做解决方案的框架,分别代表了三款产品:
E: ElasticSearch(ES),负责日志的存储和检索;
L:Logstash,负责日志的收集,过滤和格式化;
K:Kibana,负责日志的展示统计和数据可视化。
一、ELK 是什么? ELK 是三个开源框架的简写,分别是:Elasticsearch、Logstash、Kibana 。
二、安装部署 Elasticsearch 1、下载 官网下载地址:https://www.elastic.co/cn/downloads/elasticsearch
国内镜像源(华为):https://mirrors.huaweicloud.com/elasticsearch/
推荐使用国内的下载地址,官网下载太慢了。
选择合适的版本下载(推荐下载自带 JDK 的版本,否者自己配置的 JDK 可能不符合版本要求。注意:Elasticsearch 会优先使用系统配置的 JDK 。可将 Elasticsearch 自带的 JDK 配置到系统的环境变量中,如果不这样做的话,在安装 Logstash 时,启动会报没有配置 JDK 环境变量的错误。)
1 [root@localhost ~]# wget https://mirrors.huaweicloud.com/elasticsearch/7.8.0/elasticsearch-7.8.0-linux-x86_64.tar.gz
2、解压到指定目录 1 2 3 4 5 # 新建文件夹 # 解压到指定文件夹
3、修改配置文件 1 2 3 4 5 6 7 8 9 10 # 进入安装目录 # 修改config/elasticsearch.yml # 修改以下几项:
4、新建用户并赋权 1 2 3 4 5 6 7 8 9 10 11 12 13 14 # 添加用户 es # 设置用户 es 的密码(需要输入两遍密码) # (如果设置密码过于简单可能会提示 BAD PASSWORD: XXX ,如果是用 root 用户操作可忽略提示继续输入第二遍密码强制设置密码) # 将对应的文件夹权限赋予用户 es
5、切换至新建的用户并启动 Elasticsearch 1 2 3 4 5 # 切换至用户 es # 启动 ElasticSearch (-d 表示在后台启动)
错误处理
ERROR: [3] bootstrap checks failed
解决方式:
需切换到root用户解决错误:
1 2 # 切换到 root 用户
[1] 和 [2] 的解决方法:
1 2 3 4 5 6 7 # 修改 /etc/security/limits.conf 文件 # 添加以下四行
[3] 的解决方法:
1 2 3 4 5 6 7 # 修改 /etc/sysctl.conf 文件 # 添加下面一行 # 执行命令
切换到用户 es 重新启动程序就可以了。
6、验证 注意: 防火墙需要开放9200端口
1 2 3 4 5 6 [root@localhost elasticsearch-7.8.0]# firewall-cmd --permanent --add-port=9200/tcp
访问:http://192.168.40.149:9200
返回结果:
1 2 3 4 5 6 7 8 9 10 11 12 13 14 15 16 17 { "name" : "node-1" , "cluster_name" : "elasticsearch" , "cluster_uuid" : "bZD6PjHIQ1uovZrQ6nXa8Q" , "version" : { "number" : "7.8.0" , "build_flavor" : "default" , "build_type" : "tar" , "build_hash" : "757314695644ea9a1dc2fecd26d1a43856725e65" , "build_date" : "2020-06-14T19:35:50.234439Z" , "build_snapshot" : false , "lucene_version" : "8.5.1" , "minimum_wire_compatibility_version" : "6.8.0" , "minimum_index_compatibility_version" : "6.0.0-beta1" } , "tagline" : "You Know, for Search" }
三、安装部署 Kibana 1、下载 华为镜像源:https://mirrors.huaweicloud.com/kibana
选择合适的版本下载(和Elasticsearch版本保持一致)。
1 2 # 下载安装包
2、解压并移动到指定目录 1 2 3 4 5 # 解压到当前目录 # 重命名并移动到指定目录
3、修改配置文件 1 2 3 4 5 6 7 8 9 10 [root@localhost kibana-7.8.0]# vim ./config/kibana.yml# 服务端口 # 服务器ip 本机 # Elasticsearch 服务地址 # 设置语言为中文
4、授权并切换用户 给 es 用户授予 kibana 目录的权限。
1 2 3 4 5 # 授权 # 切换用户
5、启动 Kibana 注意:启动 Kibana 之前需要先启动 Elasticsearch
需要先配置防火墙打开5601端口:
1 2 3 4 5 6 7 8 9 10 11 12 [root@localhost kibana-7.8.0]# firewall-cmd --permanent --add-port=5601/tcp# 前台启动方式 # 后台启动方式
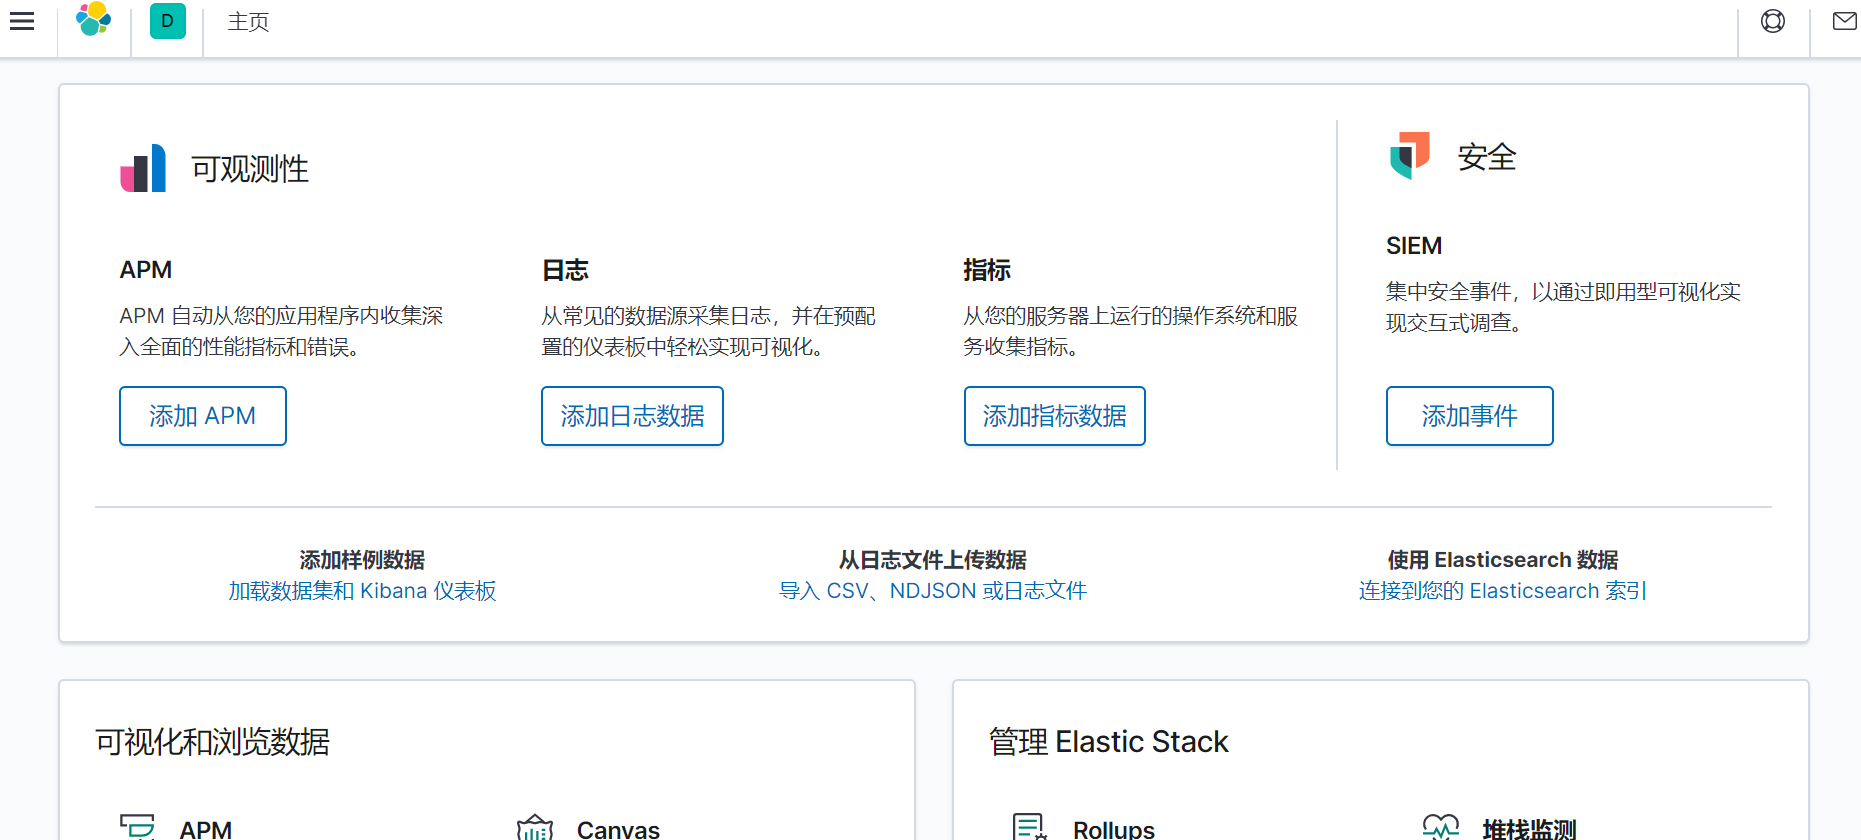
6、在浏览器中访问 Kibana 访问地址:http://192.168.40.149:5601/
四、安装部署 Logstash 1、下载安装包 华为镜像源:https://mirrors.huaweicloud.com/logstash
选择合适版本的安装包(和 Elasticsearch 保持一致)。
1 [root@localhost ~]# wget https://mirrors.huaweicloud.com/logstash/7.8.0/logstash-7.8.0.tar.gz
2、解压并移动到指定目录 1 2 3 4 5 # 解压安装包 # 移动到指定目录
3、新建配置文件 根据原有的 logstash-sample.conf 配置文件复制出一个新的配置文件并修改。
1 2 3 4 [root@localhost logstash-7.8.0]# cp config/logstash-sample.conf config/logstash-es.conf# 修改配置文件logstash-es.conf
修改成如下内容:
1 2 3 4 5 6 7 8 9 10 11 12 13 14 15 input {
配置文件logstash-es.conf内容说明:
1 2 3 4 5 6 7 8 9 10 11 12 13 14 15 input { # input输入源配置
4、安装插件 由于国内无法访问默认的gem source,需要将gem source改为国内的源。
1 2 3 4 5 # 修改Gemfile # 将source 这一行改成如下所示:
1 [root@localhost logstash-7.8.0]# ./bin/logstash-plugin install logstash-codec-json_lines
如果报以下错误,请检查是否已经配置了 JDK 环境变量。
could not find java; set JAVA_HOME or ensure java is in PATH
5、启动 Logstash 1 2 # 后台启动Logstash
五、配置项目查看结果 本示例使用的是 Spring Boot 项目。
1、引入依赖 1 2 3 4 5 <dependency > <groupId > net.logstash.logback</groupId > <artifactId > logstash-logback-encoder</artifactId > <version > 4.11</version > </dependency >
2、在resources里新建 logback.xml 配置文件 1 2 3 4 5 6 7 8 9 10 11 12 13 14 15 16 17 18 19 20 <?xml version="1.0" encoding="UTF-8" ?> <!DOCTYPE configuration > <configuration > <appender name ="LOGSTASH" class ="net.logstash.logback.appender.LogstashTcpSocketAppender" > <destination > 192.168.40.149:9601</destination > <encoder charset ="UTF-8" class ="net.logstash.logback.encoder.LogstashEncoder" /> </appender > <include resource ="org/springframework/boot/logging/logback/base.xml" /> <root level ="INFO" > <appender-ref ref ="LOGSTASH" /> <appender-ref ref ="CONSOLE" /> </root > </configuration >
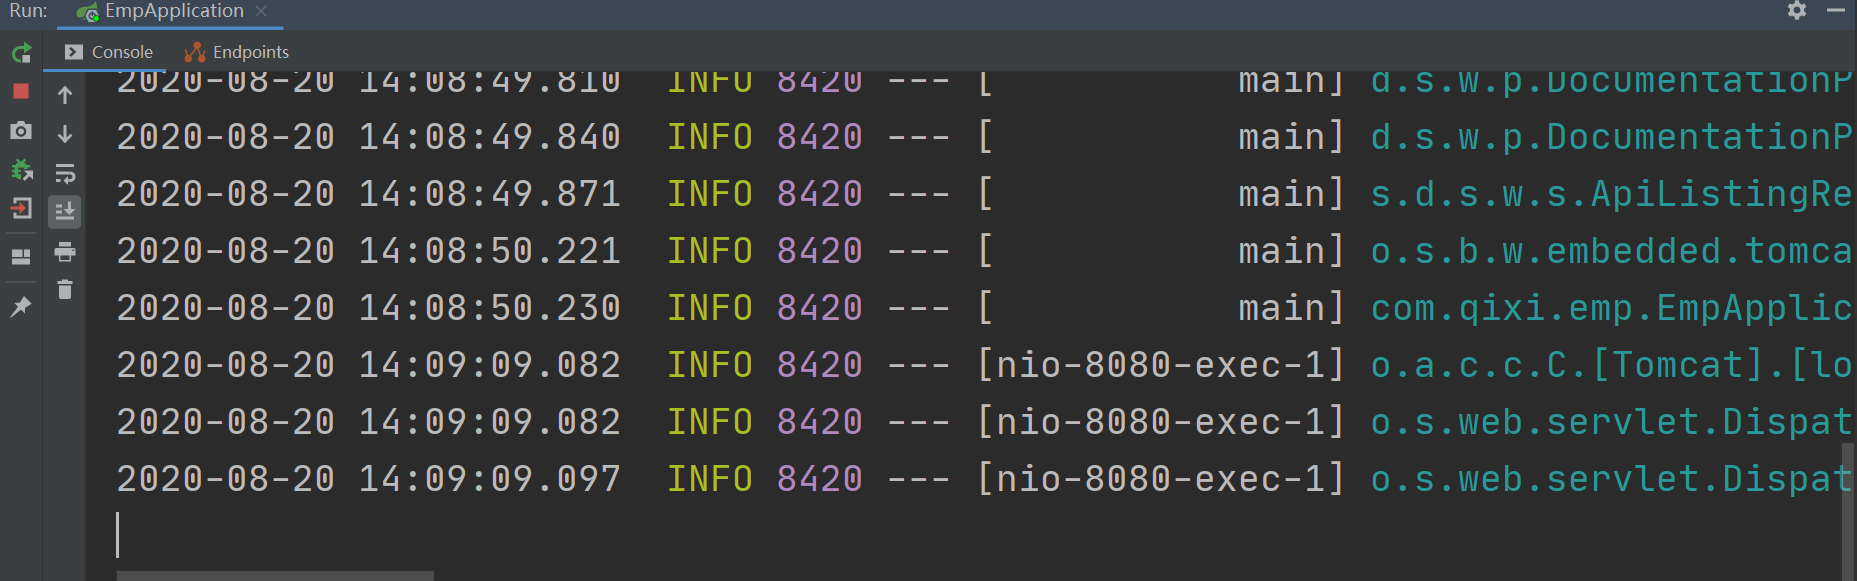
3、启动系统打印日志 启动 Spring Boot 项目:
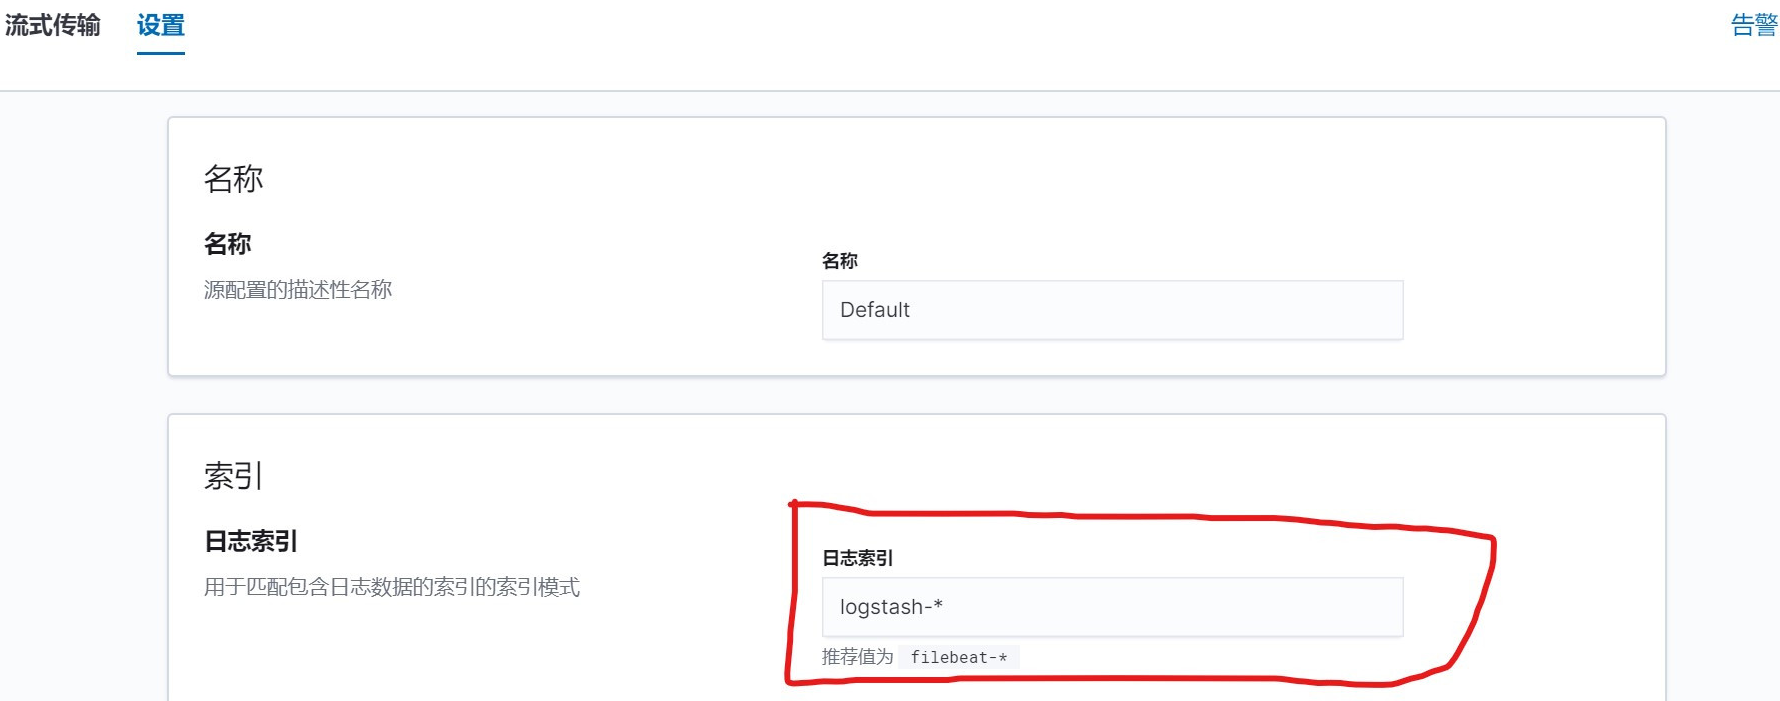
Kibana还需要配置日志读取的索引:
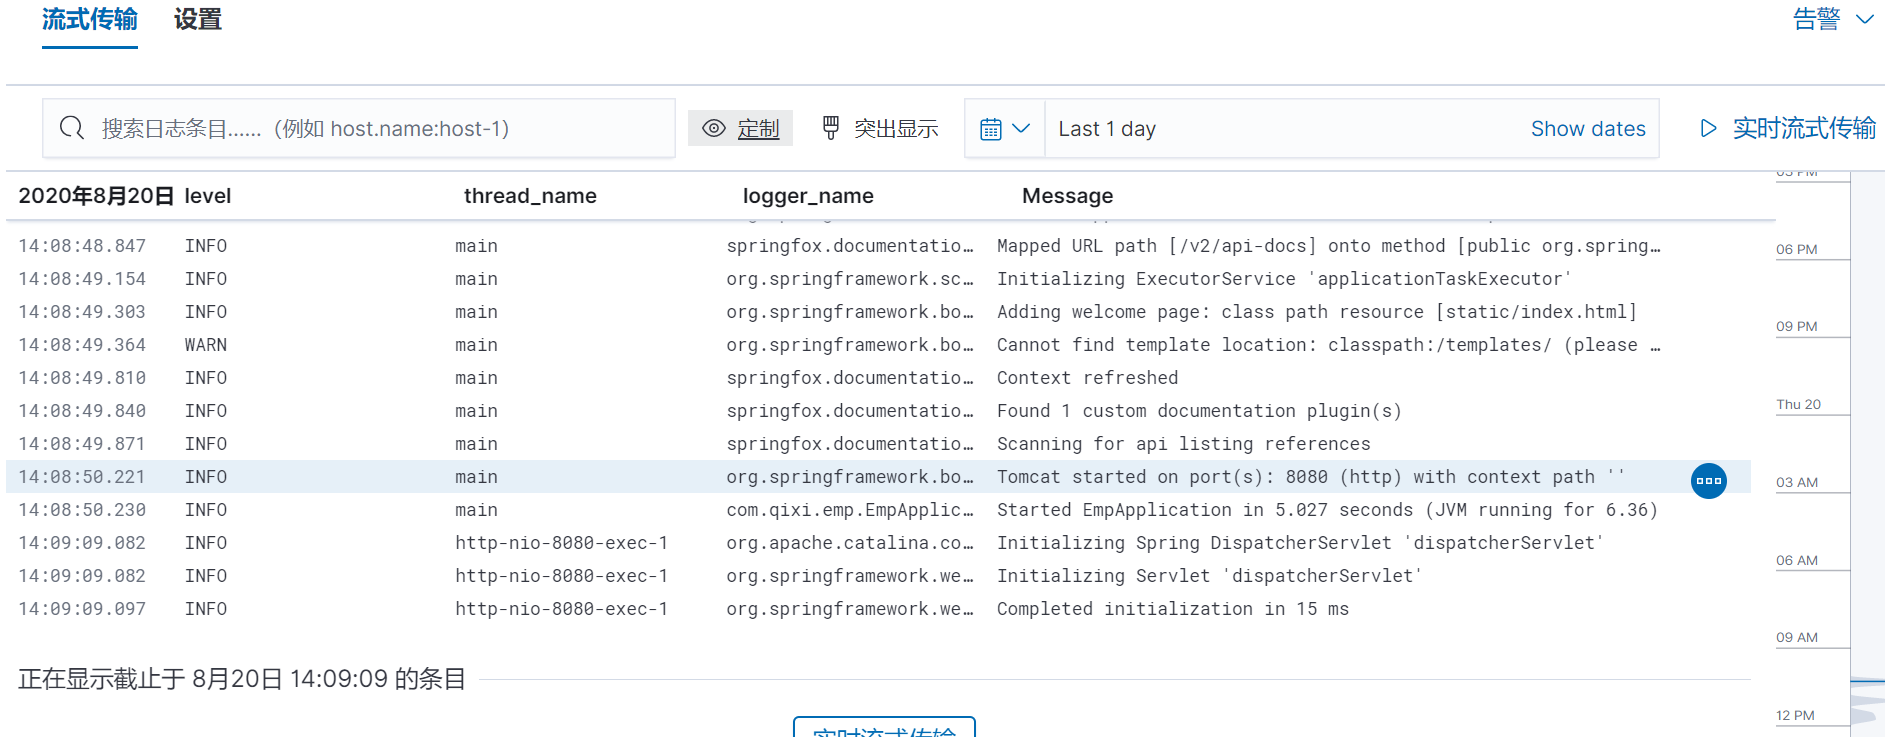
在Kinaba中查看结果: